
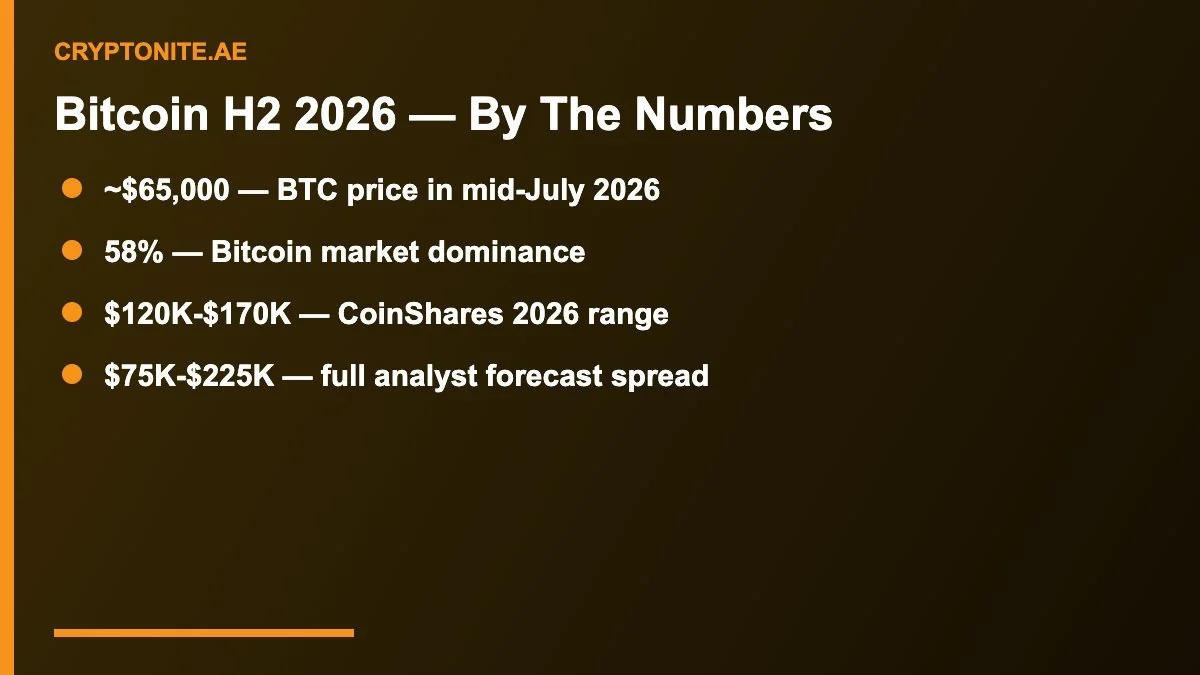
The Bitcoin price outlook for the second half of 2026 has become one of the most hotly contested debates in finance. With Bitcoin trading around $65,000 in mid-July and analyst targets ranging from a cautious $75,000 to an aggressive $225,000, the Bitcoin price outlook now hinges on a tug-of-war between resilient institutional demand and a cloudier macro backdrop. For investors in the UAE and globally, understanding the arguments on both sides matters more than fixating on any single forecast.
This guide lays out where Bitcoin stands today, the strongest bull and bear cases, what ETF flows and on-chain data suggest, and the catalysts most likely to shape the rest of the year. It is analysis, not investment advice, and no price target here should be treated as a certainty.
Where Bitcoin stands in mid-2026
As of mid-July 2026, Bitcoin has been consolidating in the mid-$60,000s, with dominance — its share of total crypto market value — hovering near 58%. That elevated dominance tells its own story: in periods of uncertainty, capital tends to concentrate in the largest, most liquid asset, and Bitcoin remains crypto’s reserve asset. The mood, by most sentiment gauges, has been cautious rather than euphoric.
Consolidation after a volatile stretch is normal, and it often precedes a decisive move in one direction. The question dominating the Bitcoin price outlook is which way that move breaks, and whether the second half of 2026 delivers the “constructive price action” some strategists expect or the correction others fear.
The bull case in the Bitcoin price outlook
The optimistic view rests on a few pillars. First is institutional demand: spot Bitcoin ETFs have made the asset accessible to pensions, advisors and corporates in a way that did not exist a cycle ago, and steady inflows can absorb supply. James Butterfill, head of research at CoinShares, has pointed to a 2026 range between roughly $120,000 and $170,000, with more constructive action likely in the second half of the year as macro conditions clarify.
Second is scarcity. Bitcoin’s supply issuance halves roughly every four years, and the reduced flow of new coins has historically tightened the market. Third is the maturing regulatory picture in major markets, which supporters argue lowers the risk premium investors attach to the asset. Taken together, the bullish Bitcoin price outlook sees limited new supply meeting durable institutional demand — a combination that, in past cycles, has driven significant appreciation.
The bear case and macro headwinds
The cautious camp is just as substantive. Macro uncertainty — shifting interest-rate expectations, questions about growth, and the ebb of the spot-ETF hype that defined earlier in the cycle — has weighed on risk appetite. Some analysts warn that a rebound into the $65,000–$68,000 zone could prove to be a bull trap, setting up another leg lower rather than a sustained recovery.
Forecasts reflect that divergence. While some models see Bitcoin drifting toward the high-$70,000s to mid-$80,000s by year-end, more bearish scenarios contemplate a slide toward $75,000 or below if macro conditions deteriorate. The bearish Bitcoin price outlook does not deny Bitcoin’s long-term thesis; it simply argues that the path through late 2026 could be bumpy, and that leverage and over-optimism remain risks.
What ETF flows say about the Bitcoin price outlook
Exchange-traded fund flows have become one of the clearest real-time gauges of institutional sentiment, and they complicate any simple narrative. Recent months have seen capital rotate — out of some Bitcoin and Ether products and into XRP, Solana and yield-bearing structures — even as Bitcoin ETFs recently snapped a multi-day outflow streak. The lesson for the Bitcoin price outlook is that institutional money is becoming more selective, not disappearing.
Flows should be read over months, not days, because single-session moves often reflect rebalancing or arbitrage rather than conviction. Sustained net inflows would strengthen the bull case; persistent outflows would validate the bears. For now, the flow picture is mixed, which mirrors the broader uncertainty in the market.
Institutional adoption and the halving cycle
Beyond ETFs, the structural story of 2026 is that Bitcoin has become embedded in mainstream finance. Corporates hold it on balance sheets, wealth platforms offer it, and regulated custody has matured. That institutionalization tends to dampen the extreme volatility of earlier eras while adding a steadier, if less explosive, demand base. It is a double-edged development for the Bitcoin price outlook: fewer parabolic runs, but arguably firmer support.
The halving cycle remains a reference point for many analysts, who note that Bitcoin’s most significant advances have historically followed supply reductions with a lag. History is not destiny, however, and each cycle unfolds against a different macro and regulatory backdrop. Treating past patterns as loose context rather than precise roadmaps is the disciplined way to use them.
Key levels and catalysts to watch
Several catalysts could tip the balance. Macro data — inflation prints, central-bank guidance and growth signals — will strongly influence risk appetite across all assets, Bitcoin included. Regulatory milestones, including progress or gridlock on US market-structure legislation, could shift sentiment. And ETF flow trends will keep offering a live read on institutional conviction.
On the charts, market participants watch whether Bitcoin can hold its mid-$60,000s footing and reclaim higher levels, or whether it loses support and tests lower zones. These technical markers are not predictions; they are simply the levels around which traders cluster. Anyone using them should pair them with fundamentals and an honest assessment of risk rather than treating them as guarantees.
The UAE and Gulf angle
For readers in the UAE and wider Gulf, the Bitcoin price outlook carries regional resonance. The Emirates has built one of the world’s most developed regulatory frameworks for virtual assets through VARA and the FSRA, and Gulf sovereign and private capital has shown growing interest in digital assets. A constructive second half could accelerate regional allocation, while a correction would test conviction.
Crucially, the region’s institutional approach favors regulated access, custody and risk management over speculation — a posture well suited to navigating an uncertain Bitcoin price outlook. For Gulf allocators, the debate is less about calling the exact bottom or top and more about sizing exposure sensibly within a diversified framework.
How the 2026 macro backdrop shapes Bitcoin
No asset trades in a vacuum, and the Bitcoin price outlook for the back half of 2026 is inseparable from the broader macroeconomic picture. Interest-rate expectations, the trajectory of inflation, currency strength and global growth all shape how much appetite investors have for risk assets, and Bitcoin — despite its “digital gold” framing — still behaves like a high-beta risk asset much of the time. When markets expect looser policy and falling real yields, capital tends to flow toward assets like Bitcoin; when the outlook tightens, that same capital retreats to safety. Through 2026, shifting expectations on all of these fronts have kept the market on edge and prevented a decisive trend from forming.
The nuance is that Bitcoin’s relationship with macro is not fixed. In some stretches it has traded as a pure risk asset, rising and falling with equities; in others it has decoupled, responding more to crypto-specific catalysts such as ETF launches or regulatory news. Anyone forming a Bitcoin price outlook needs to watch which regime the market is in, because the same macro headline can produce very different reactions depending on positioning and sentiment. That variability is part of why confident single-number forecasts so often miss.
Reading on-chain signals in the Bitcoin price outlook
Beyond price charts and macro data, Bitcoin offers something traditional assets do not: a transparent ledger. On-chain analytics let researchers observe how coins are moving, how much supply has not changed hands in a long time, and whether long-term holders are accumulating or distributing. These signals add texture to any Bitcoin price outlook. When a large share of supply sits dormant in the wallets of long-term holders, it suggests conviction and reduces the coins available to sell; when dormant supply starts moving, it can foreshadow increased selling pressure.
Other on-chain measures track the behavior of miners, the flows into and out of exchanges, and the realized profit or loss of coins being spent. None of these is a crystal ball, and they can send conflicting signals, but together they provide a richer, more grounded read than sentiment alone. For a balanced Bitcoin price outlook, on-chain data is best used as corroboration — a way to check whether the story told by price and flows is consistent with what holders are actually doing on the network.
Corporate treasuries and the new demand base
One of the defining shifts of recent years is the emergence of Bitcoin as a treasury asset. A growing roster of public and private companies now hold Bitcoin on their balance sheets, treating it as a reserve asset or a hedge against currency debasement. This corporate demand adds a structural buyer that did not exist in earlier cycles, and it tends to be stickier than speculative retail flows because it is tied to long-term strategy rather than short-term trading. That stickiness is a meaningful, if underappreciated, pillar of the bullish Bitcoin price outlook.
There is a flip side. Concentrated corporate holdings can also become a source of risk if a large holder is forced to sell during a downturn, and the leverage some of these strategies employ can amplify moves in both directions. The maturation of a corporate demand base is therefore a double-edged development: it deepens the market and adds resilience, but it also introduces new potential fault lines that a complete Bitcoin price outlook must acknowledge.
Volatility, leverage and risk management
Whatever direction Bitcoin ultimately takes, one near-certainty is volatility. Bitcoin remains capable of double-digit percentage swings in a matter of days, and leverage in the derivatives market can turn ordinary moves into violent ones. Periods of heavy leverage often end in sharp liquidations that overshoot in both directions, which is why seasoned participants pay close attention to funding rates and open interest as gauges of how stretched the market has become. An honest Bitcoin price outlook treats volatility not as a bug to be forecast away but as a permanent feature to be managed.
For investors, that means risk management matters more than prediction. Position sizing, diversification, and a clear plan for both upside and downside scenarios tend to serve people far better than any attempt to time the exact top or bottom. The most durable participants in Bitcoin’s history have generally been those who survived the drawdowns rather than those who called them perfectly. That discipline is the practical heart of engaging with any Bitcoin price outlook responsibly.
Historical cycles and what they do and don’t tell us
Bitcoin’s past is littered with cycles of boom and bust, and pattern-seekers naturally look to history for guidance. The halving cycle — the roughly four-year rhythm of supply reductions — has coincided with major advances in the past, and many analysts anchor their Bitcoin price outlook to where the market sits within that cycle. There is a logic to it: reduced new supply, all else equal, tightens the market. But the sample size is small, and each cycle has played out against a very different macro, regulatory and adoption backdrop.
The danger is treating loose historical rhythms as precise timetables. The maturation of the market, the arrival of ETFs and institutions, and the sheer growth in Bitcoin’s size all mean that past percentage moves may not repeat. History is useful for framing the range of what is possible and for tempering both euphoria and despair, but it should inform a Bitcoin price outlook rather than dictate it. The investors who fare worst are often those who assume the next cycle must mirror the last.
Scenarios for the Bitcoin price outlook into year-end
Rather than a single prediction, the most useful way to hold the Bitcoin price outlook is as a set of scenarios. In a constructive scenario, easing macro conditions, steady ETF inflows and continued institutional adoption combine to lift Bitcoin back toward and beyond its prior highs, validating the more bullish forecasts. In a range-bound scenario, competing forces cancel out and Bitcoin chops sideways in a wide band, frustrating both bulls and bears. In a bearish scenario, macro deterioration and risk-off sentiment drag Bitcoin lower, testing support well below current levels.
Assigning probabilities to these scenarios is where reasonable analysts diverge, and where humility is essential. The value of scenario thinking is that it prepares an investor for multiple outcomes rather than betting everything on one. A robust approach to the Bitcoin price outlook accepts that the future is genuinely uncertain, plans for each branch, and avoids the trap of falling in love with a single narrative. That mindset, more than any specific target, is what tends to protect capital through Bitcoin’s inevitable turbulence.
How to follow the Bitcoin price outlook responsibly
For readers who want to track the Bitcoin price outlook without being whipsawed by every headline, a few habits help. Focus on a small set of high-quality signals — macro releases, aggregate ETF flows over weeks, and a handful of on-chain measures — rather than reacting to every price tick or social-media call. Keep a written thesis for why you hold the view you do, and revisit it when the facts change rather than rationalising after the fact. And be deeply skeptical of anyone promising certainty, especially precise price-and-date predictions, because the honest truth is that no one knows the future.
It also helps to separate time horizons. The short-term Bitcoin price outlook is dominated by sentiment, positioning and macro noise, and is genuinely hard to predict. The multi-year outlook rests more on adoption, supply dynamics and the maturation of infrastructure, where the trend has been clearer. Conflating the two — using a long-term thesis to justify a short-term trade, or panicking about a long-term holding because of a bad week — is a common and costly error. Clarity about which horizon you are actually operating on is one of the most underrated tools an investor has.
Ultimately, the Bitcoin price outlook for the second half of 2026 will be written by the interplay of forces no single person controls: central banks, regulators, institutions and millions of individual participants. The best any observer can do is understand those forces, weigh the evidence fairly, and act with discipline and humility. That approach will not guarantee good outcomes, but it stacks the odds in your favour far better than chasing forecasts ever could. As always, this is information rather than investment advice, and professional guidance is worth seeking for decisions that matter.
What it means
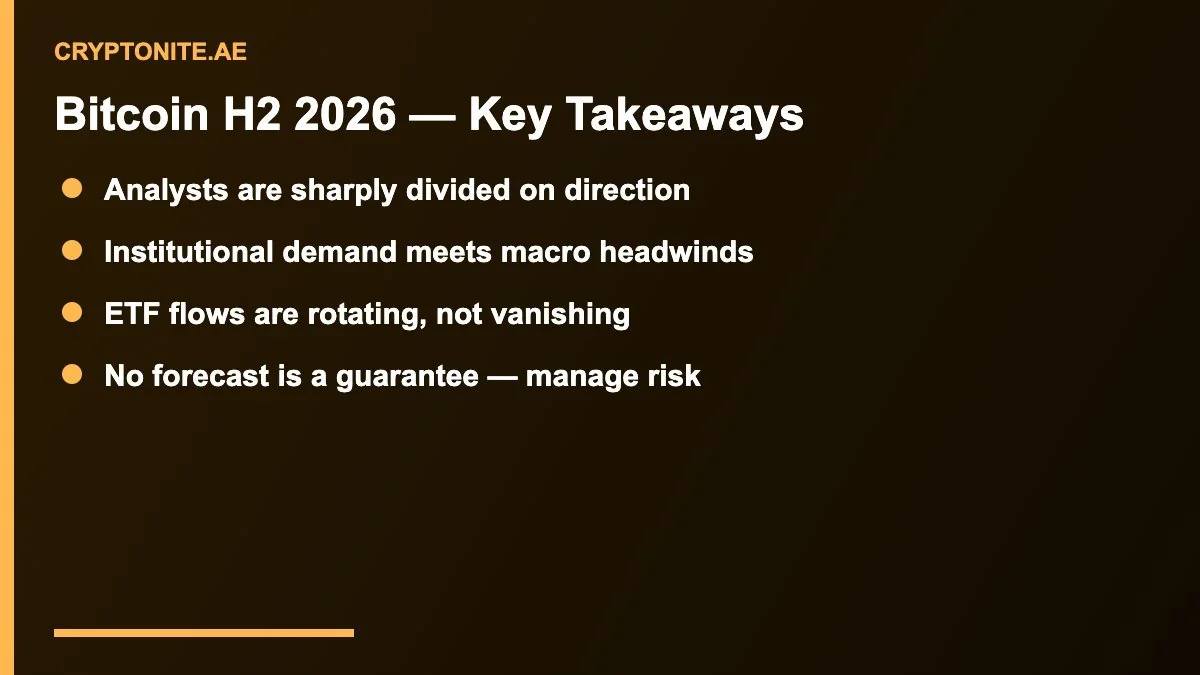
The honest summary of the Bitcoin price outlook for the second half of 2026 is that credible analysts genuinely disagree, and the range of outcomes is wide. The bull case leans on scarcity and institutional demand; the bear case leans on macro headwinds and stretched positioning. Both are legitimate, which is precisely why humility beats certainty here.
The practical takeaway is to focus on process rather than prophecy: understand the drivers, watch the flows and macro data, size positions to survive volatility, and treat every forecast — bullish or bearish — as a scenario rather than a promise. This article is information, not investment advice, and readers should do their own research and consider professional guidance before acting.
Related on Cryptonite: our Bitcoin price analysis for 2026, Bitcoin ETF inflows and the crypto ETF rotation.
Sources: CoinDesk, CoinGecko, CNBC.
What is the Bitcoin price outlook for the second half of 2026?
Analysts are divided. Forecasts for 2026 range from about $75,000 in bearish scenarios to $225,000 in the most bullish, with CoinShares citing a $120,000-$170,000 range. Bitcoin traded near $65,000 in mid-July 2026.
What could move Bitcoin in late 2026?
Key catalysts include macro data and interest-rate expectations, ETF flow trends, regulatory progress such as US market-structure legislation, and the lagged effects of the halving cycle. None of these guarantees a specific price.

5 thoughts on “Bitcoin Price Outlook: The Big Debate Over the Second Half of 2026”