Bitcoin price this week did almost nothing, and that is the story. Across the first week of August 2026 the asset traded in a band of roughly $2,000 — a dip to about $62,500 that buyers immediately defended, a ceiling it could not clear near $65,000, and a Friday close around $64,300. Realised volatility compressed to some of its lowest readings in two years. For a market that has spent nine months in a drawdown, a week this quiet is not nothing. It is a coiled spring, and the argument is about which way it releases.
Key takeaways: the $62,500 floor held on the one occasion it was tested; spot Bitcoin ETFs took in net inflows every trading day of the month so far; one-month realised volatility sits near two-year lows; overhead supply begins around $66,800; and Bitcoin remains roughly 49 per cent below its October 2025 peak while global equities print records.
Bitcoin price this week: the numbers
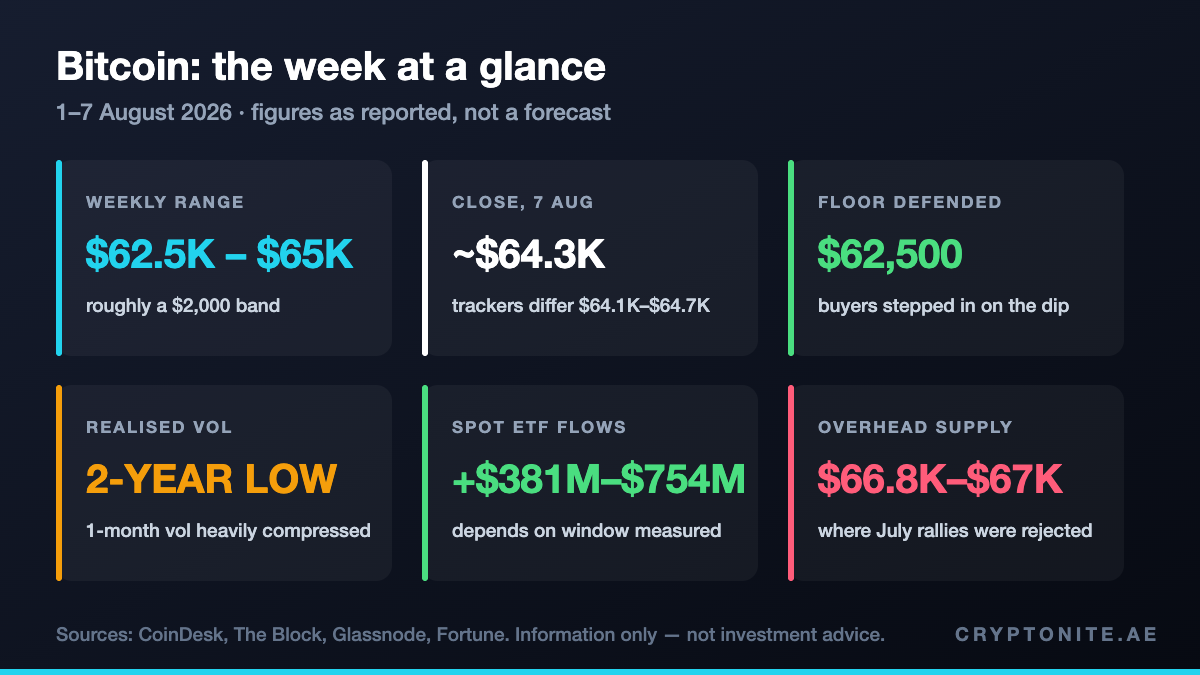
The week’s shape was simple. Bitcoin drifted lower into the first days of August, touched roughly $62,500, and found bids. It spent the balance of the week grinding between the low and mid $64,000s, and closed Friday at approximately $64,300 on the daily candle, having briefly printed near $64,600.
One point of housekeeping, because precision matters more than confidence here. Trackers do not agree on the exact Friday print — quotes across major sources on 7 August ranged from about $64,167 to $64,700, depending on the venue, the snapshot time and whether the figure is a spot index or a single exchange close. The differences are small, but they are real, and any single number quoted to the dollar — including ours — should be read as one venue’s snapshot rather than a canonical price.
The volatility squeeze is the week’s real signal
One-month realised volatility has compressed to levels rarely seen in the past two years. That matters because volatility is mean-reverting in a way that price is not: extended compression tends to resolve into expansion, and the direction of that expansion is what everyone is now positioning around.
Glassnode’s framing is the one worth sitting with. Historically, when one-month realised volatility has squeezed to comparable levels, the release has almost always resolved upward. But the analysts add a caveat that deserves as much weight as the base rate: previous squeezes formed with a demand engine idling in the background, whereas this one is forming with the rails in reverse and the exhaustion leg arguably unfinished. In plain terms — the pattern says up, the context says be careful, and the honest answer is that both can be true until the range breaks.
Derivatives desks appear to share that ambivalence. Options flow through the week favoured downside protection at $62,000 and $63,000, which is the behaviour of a market that has a spot bid but limited conviction in it. Buying insurance directly beneath the level you are defending is not a bullish posture; it is a hedged one.
ETF flows turned positive — and the size depends on who is counting
The institutional bid returned in a way it had not for months. Spot Bitcoin ETFs recorded net inflows on every trading day of August so far, with no single day of net outflows — a clean streak after a summer defined by redemptions.
The magnitude, however, is genuinely disputed. One widely cited tally put first-week inflows at roughly $754 million. Another reported about $381 million for the same broad period. A third counted $626 million across just three days. These are not contradictions so much as different windows and different fund universes: some counts run Monday-to-Friday, others run to the latest settled day, and some include or exclude specific issuers. Rather than pick the most flattering figure, treat the range as the finding: somewhere between roughly $380 million and $750 million of net demand, which is meaningful but modest against the scale of the outflows that preceded it.
That distinction matters for interpretation. Inflows of this size signal that institutional demand is returning; they do not yet signal that it has recovered.
The levels that decide the next move
Three prices frame the range. Below, $62,500 is the level buyers defended this week, and $62,000 is where the protective options bid clusters. Above, $65,000 has repeatedly capped rallies, and the heavier overhead supply sits at $66,800 to $67,000 — the zone where July’s advances were rejected.
Michael Terpin put the downside case bluntly when he joined Aura8 Episode 71 with Vaibhavv Ali this week:
We’ve got a very tightening band of resistance… We’ve had a hard time breaking above sixty-five. Yet we’ve seen about sixty-two support. We go below sixty-two, I think I’ve said that’s a trap door… it’s going to basically lead to us going below sixty. And when we breach sixty, there’s going to be a lot of people who are selling… it opens the door to then go to fifty-eight.
Michael Terpin, author of Bitcoin Supercycle, on Aura8 Ep71
The opposing read has equally serious backing. CoinDesk reported this week that a head-and-shoulders bottom may be building beneath the flat price action — a formation that, if the neckline gives way on volume, would argue for a move toward the mid $70,000s. The published caveat attached to that analysis was regulatory: an unresolved CLARITY Act keeps a lid on the institutional flows such a move would need.
Two competent reads, one range, opposite conclusions. That is the accurate description of the tape right now, and anyone presenting it as settled in either direction is selling something.
The context nobody should ignore: a nine-month underperformance
The quiet week sits inside a much less comfortable year. At roughly $64,300, Bitcoin is about 49 per cent below its October 2025 all-time high near $126,000. Published drawdown figures vary between 48 and 50 per cent depending on the reference date, but the arithmetic from that peak is straightforward.
The relative picture is starker than the absolute one. Global equities have advanced roughly 10 to 11 per cent in the first half of 2026, with Japan up around 17 per cent and emerging markets up about 22 per cent, while Bitcoin has fallen. Rolling 63-day data shows the asset lagging the S&P 500 since October — described by analysts tracking it as the longest such stretch on record.
Historical context cuts both ways here. A 48 to 50 per cent drawdown is materially shallower than the 64 and 73 per cent declines of previous cycles, which bulls read as resilience. Bears read the same data as a cycle that has not finished doing what cycles do. Both are looking at the same chart.
What it means
For allocators, the week produced one genuinely useful data point and one genuinely useful non-event. The data point is that the institutional bid is present again, if modest. The non-event is that a tested support level held without needing a catalyst to hold it.
What the week did not produce is resolution. A compressed range with hedged positioning and unresolved US market structure legislation is a market waiting for permission. As we argued in our analysis of why the CLARITY Act is unlikely to pass in 2026, that permission may not arrive on the timeline most desks have penciled in — which makes the range itself, rather than any target above or below it, the thing worth watching.
The practical read: the levels are unusually clean right now. $62,500 below, $65,000 above, $66,800 beyond that. Ranges this tight do not last, and when this one breaks it will tell you more in a session than the previous fortnight has.
Sources: CoinDesk; The Block; Fortune; Glassnode; Aura8 Episode 71 with Vaibhavv Ali and Michael Terpin.
This article is information and market commentary only, not financial or investment advice. Nothing here is a price prediction or a recommendation to buy or sell any asset. Levels and figures are as reported on 7 August 2026 and will change. Digital assets are volatile. Always do your own research and consult a licensed professional before acting.