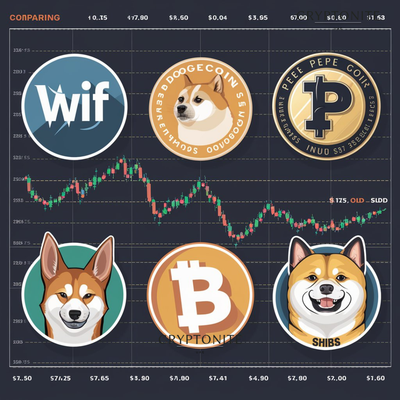
Following the market recovery between May 3 and 4, memecoins once again stole the spotlight. As expected, dogwifhat [WIF] led the pack with a 20.58% increase over 24 hours. Dogecoin (DOGE) also saw a rise of 13.80%, while Pepe (PEPE) experienced a 12.93% increase.
Additionally, Floki (FLOKI), Bonk (BONK), and Shiba Inu (SHIB) joined the rally, with their prices surpassing many other assets in the market.
WIF vs. DOGE
At present, WIF is priced at $3.32, with the 4-hour chart indicating no apparent resistance ahead. If this trend persists, it could impede bears from halting WIF’s bullish trajectory.
The 1.618 golden ratio suggests that the meme coin might aim for $4.36 as its subsequent support level. Additionally, there is a correlation between DOGE and WIF. Should this correlation persist, DOGE could potentially experience a 19.17% increase. Based on its current price, DOGE could ascend to around $0.18 in the near term.
Traders should exercise caution, considering that the RSI indicates WIF is overbought, and DOGE is nearing a similar condition. If profit-taking initiates, it could lead to retracement in the prices of these cryptocurrencies. Conversely, a bullish scenario could result in their values increasing further.
Pepe vs. Floki
PEPE’s market structure resembled that of WIF, and FLOKI also followed suit. As per the 4-hour chart, both PEPE and FLOKI broke out due to the bullish flag formation, likely prompted by sellers’ exhaustion. Consequently, if PEPE’s price surges, there’s a strong possibility that FLOKI will follow suit. Conversely, if
PEPE’s price declines, FLOKI might experience a similar drop. Additionally, the Awesome Oscillator (AO) displayed positivity, signaling a growing upward momentum.
Hence, it’s likely that the price of PEPE will maintain its upward trajectory, along with that of FLOKI. Moreover, the On Balance Volume (OBV) witnessed an uptick, indicating strong buying pressure supporting the price.
Bonk vs. Shib
A comparison of the BONK and SHIB charts revealed divergent trends. While their prices moved in tandem at times, they exhibited decoupling at other instances. However, the Money Flow Index (MFI) on the BONK/USD 4-hour chart indicated that the token was in an overbought state, with an MFI reading of 89.99.
An MFI reading surpassing 80.00 signifies overbought conditions, suggesting that capital flow was robust. Nevertheless, traders might soon opt to withdraw their investments, potentially leading to a decline in SHIB and BONK prices.
May 2024, Cryptoniteuae